The last time I went to Disneyland Paris, I used my smartphone to record the G-forces during some rides. I used an app called Physics Toolbox Accelerometer to record the acceleration to CSV files. Then, I made a small Python script to filter the data and plot it.
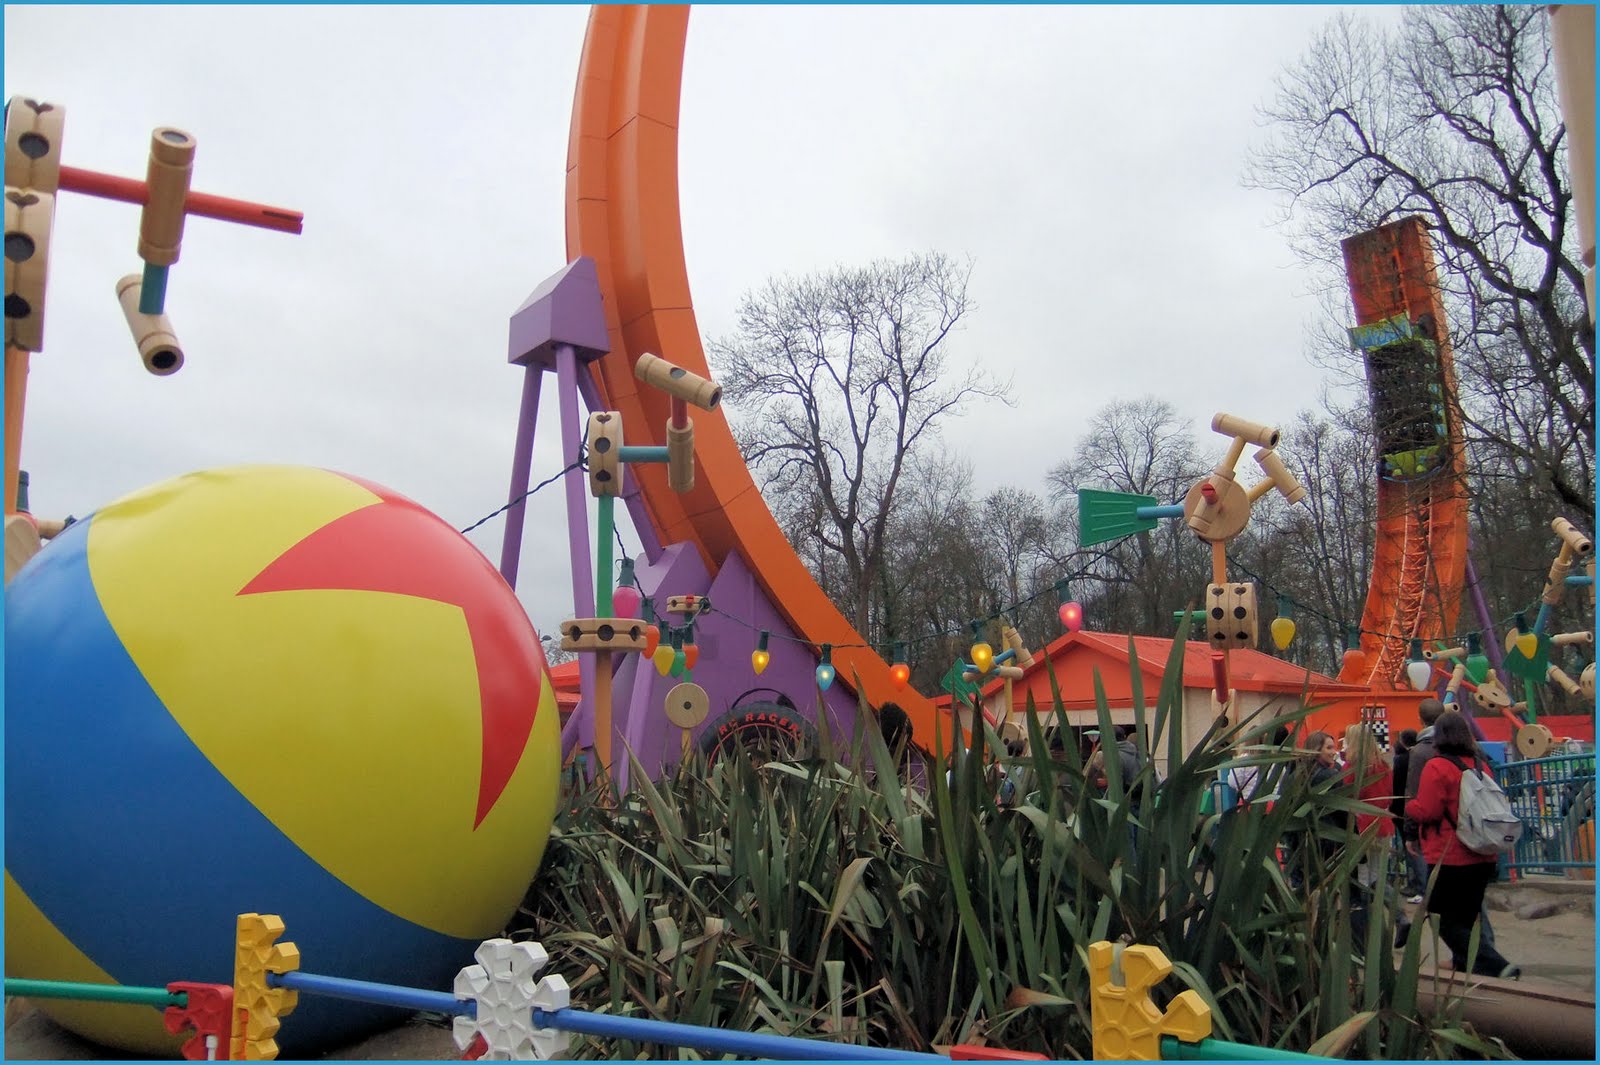
In this attraction, a cart looking like the RC car in Toys Story rolls back and forth on a U-shaped track. The acceleration measured is the following:
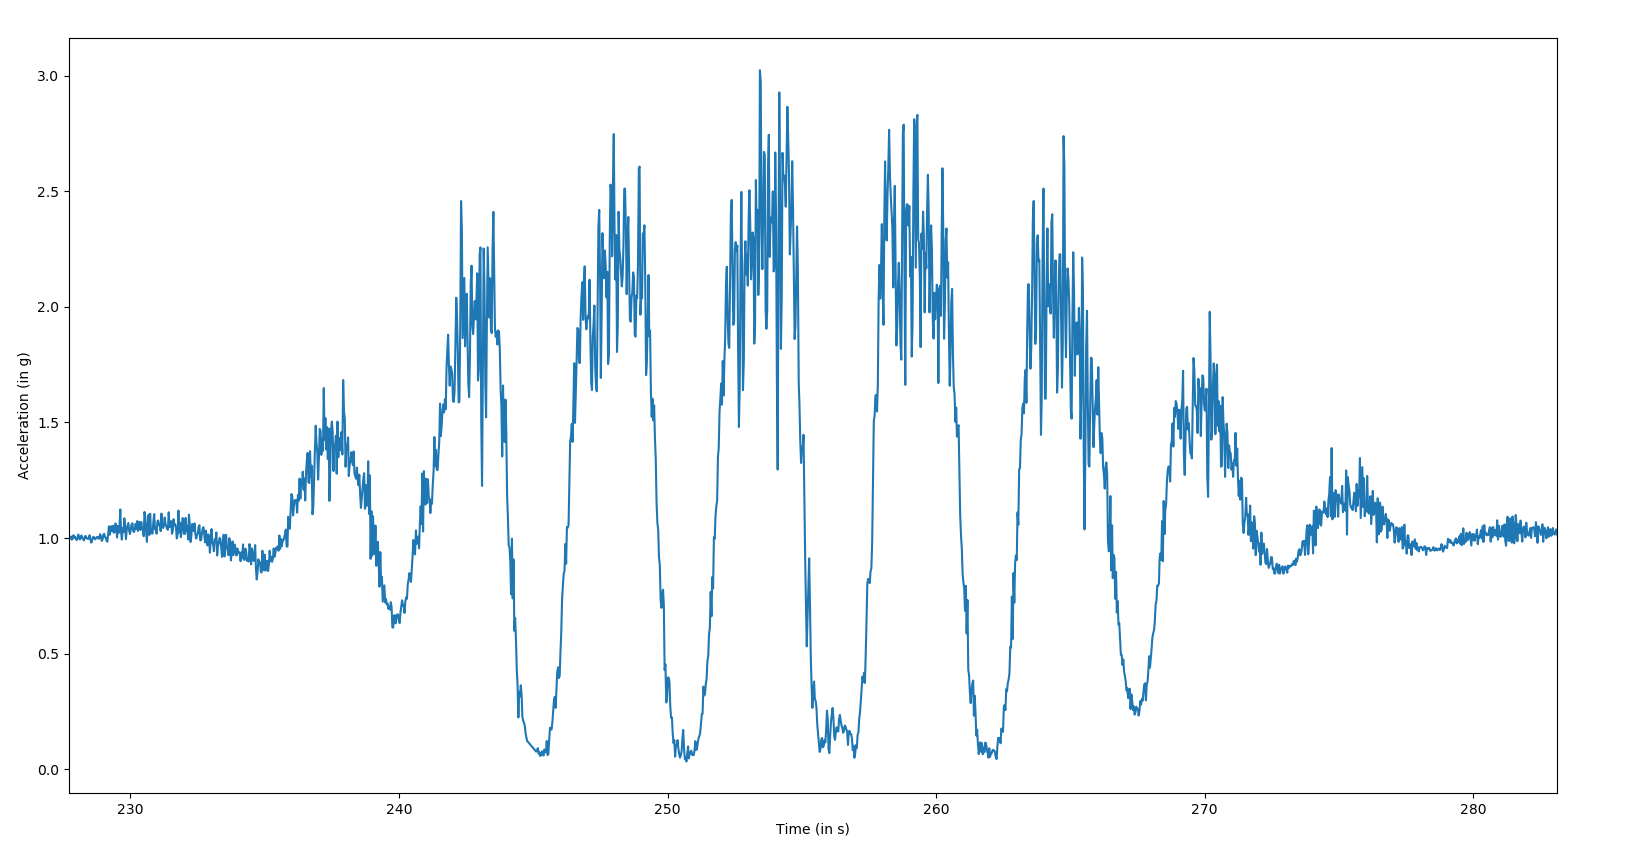
We can clearly see the moment of minimum acceleration, when the car is on top of the track, about to fall down. We can also see the moments when the car is horizontal, at the bottom of the track when the acceleration is maximal. When first looking at the data, I did not expect to see such a smooth and sine-looking graph.
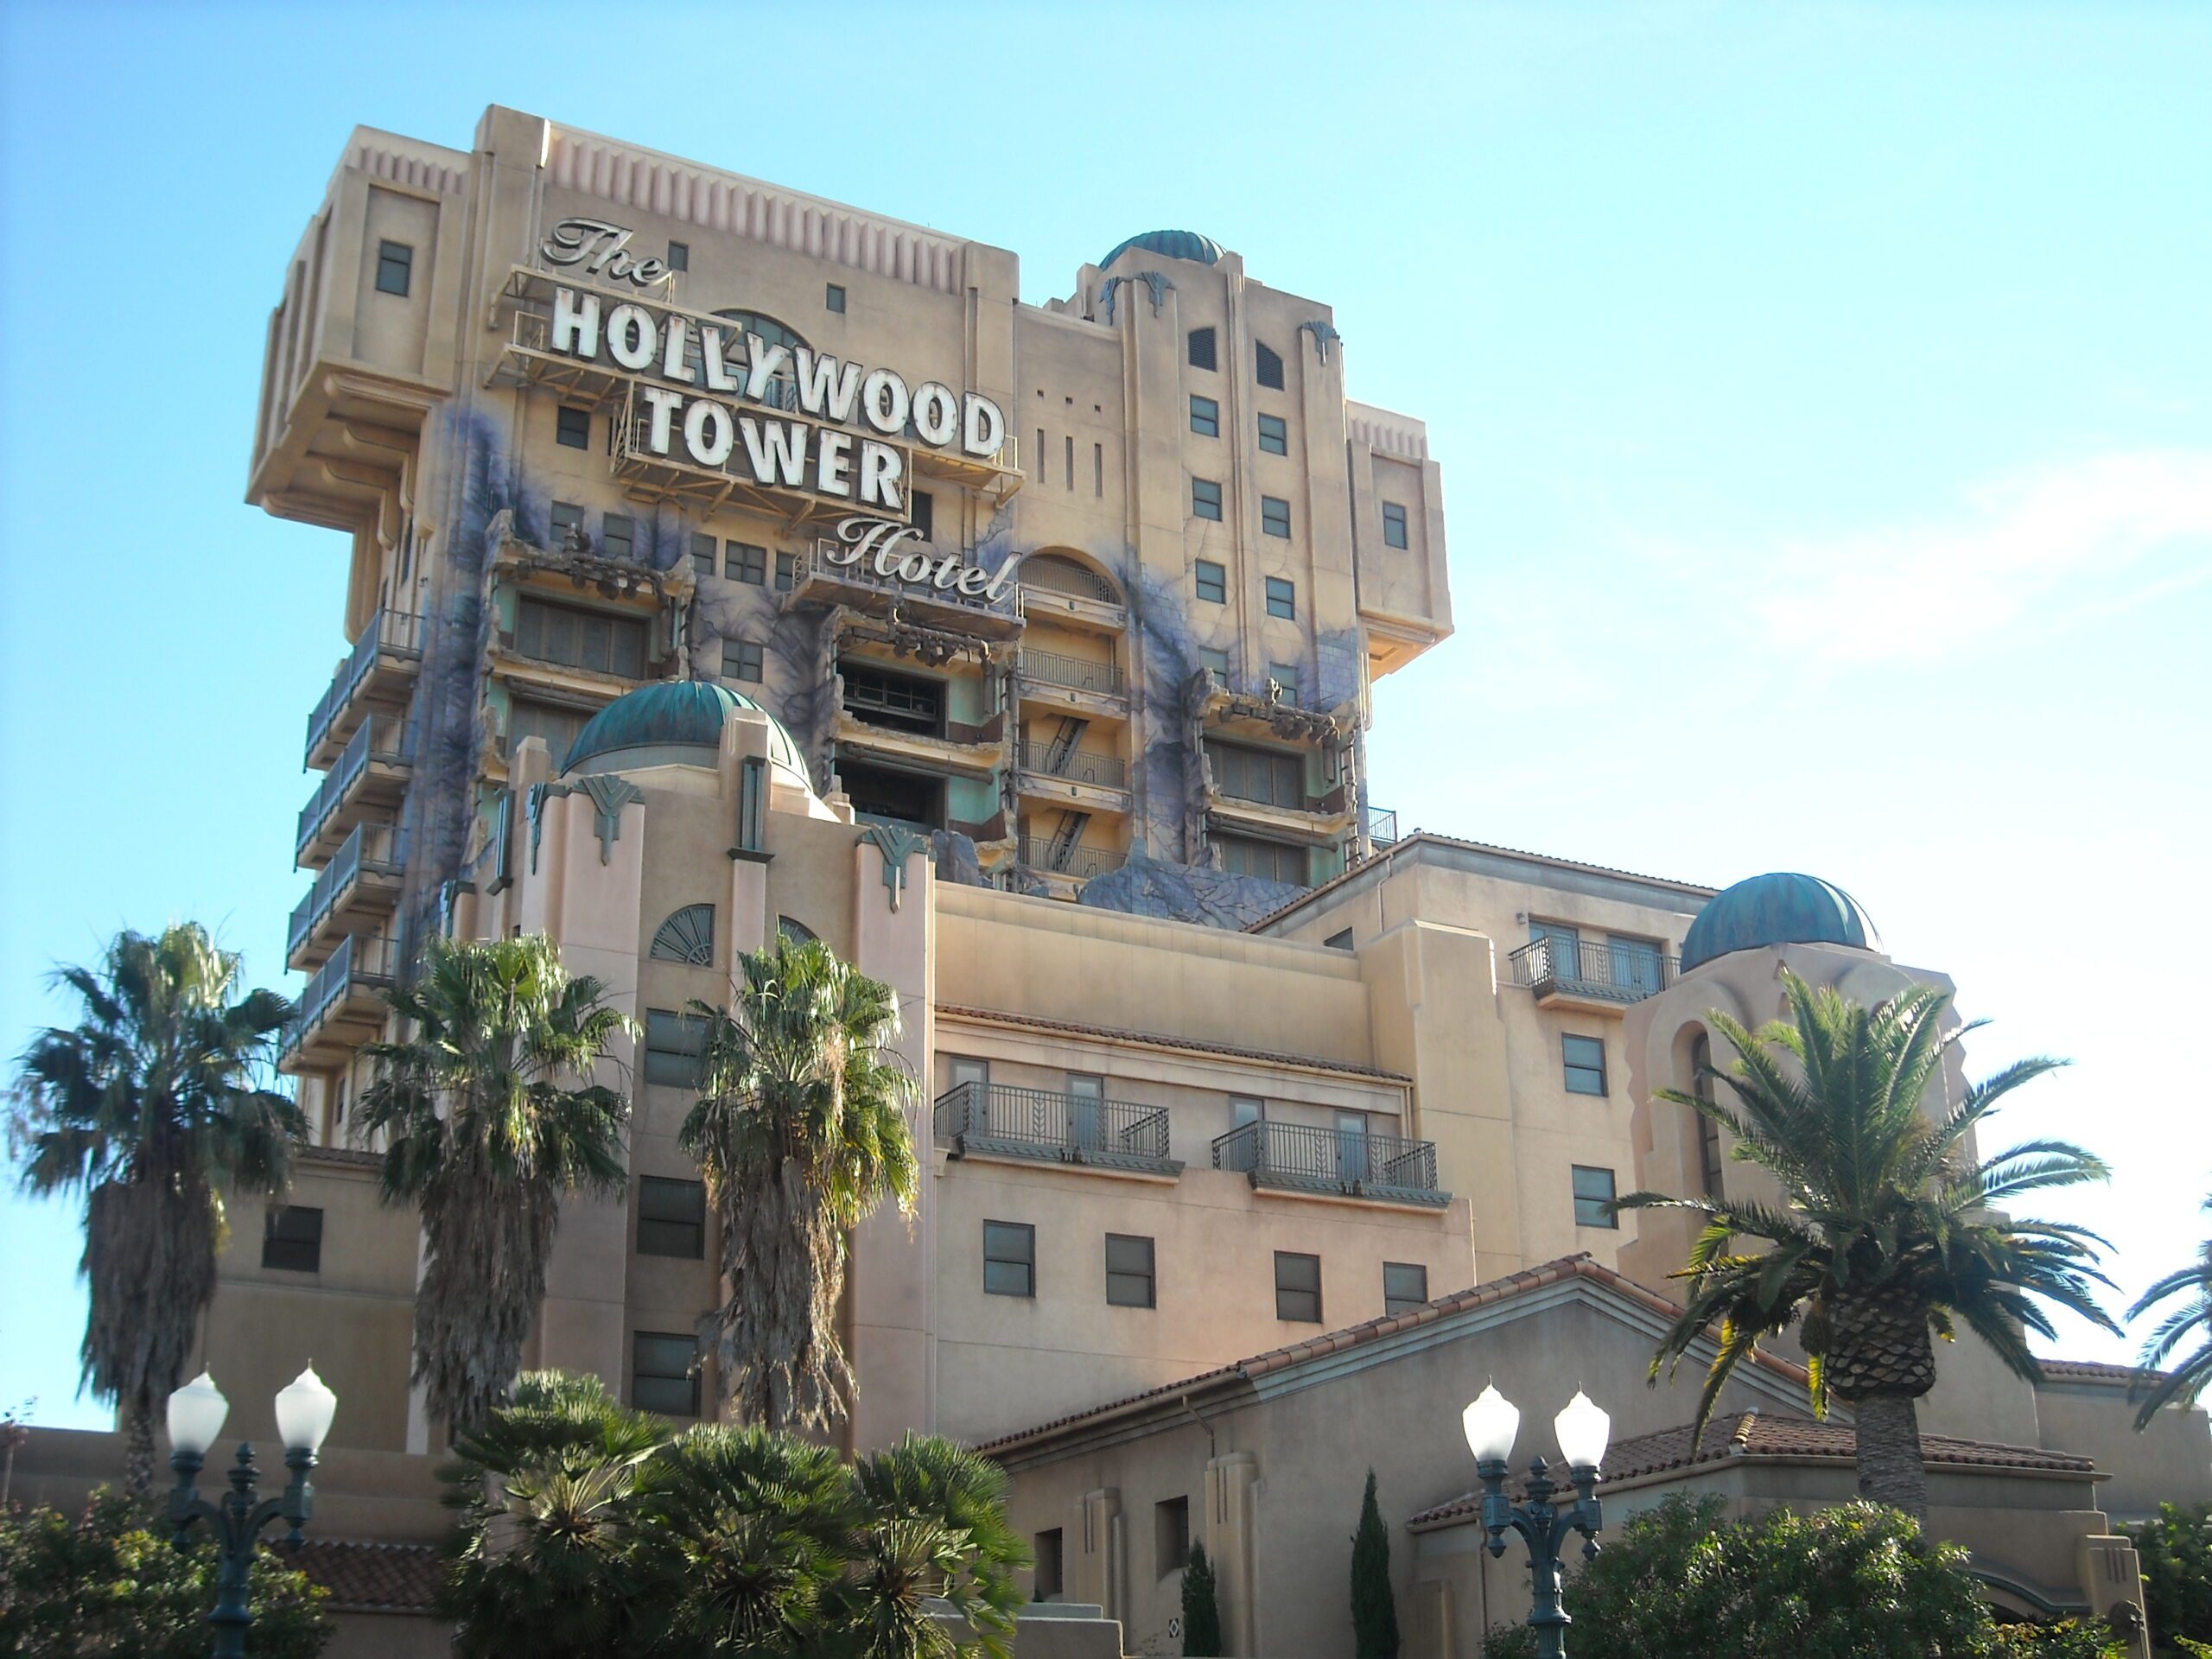
Hollywood Tower Hotel is an attraction where an elevator cabin drops before climbing swiftly. The acceleration measured is the following:
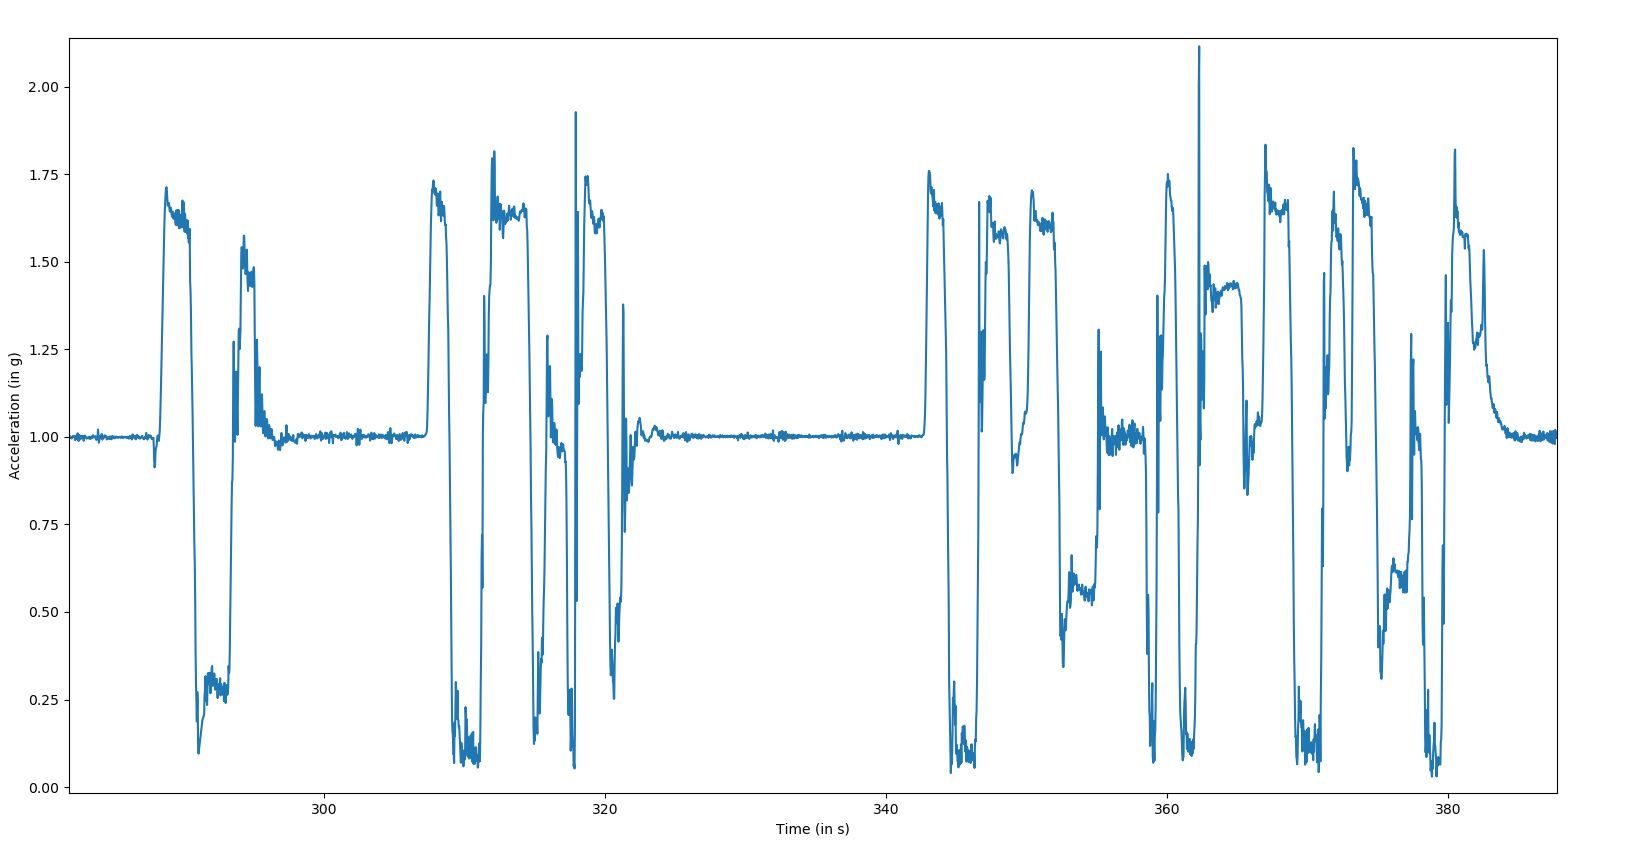
We can see the climbs as sustained high g-forces and the drops as sustained low g-forces. Between series of drops, there is some atmosphere-creating projection, where there is no acceleration one way or another.

Indiana Jones and the Temple of Doom is a roller coaster with loops and other intense steps. The acceleration measured is the following:
The first two peaks we see are small drops in the track that are at the beginning of the attraction. Then, the pack of peaks is the rest of the attraction, with a lot of intense turns and loops close to each other. The graph looks a bit messier than the two previous ones and this reflects what we feel when doing this roller coaster.

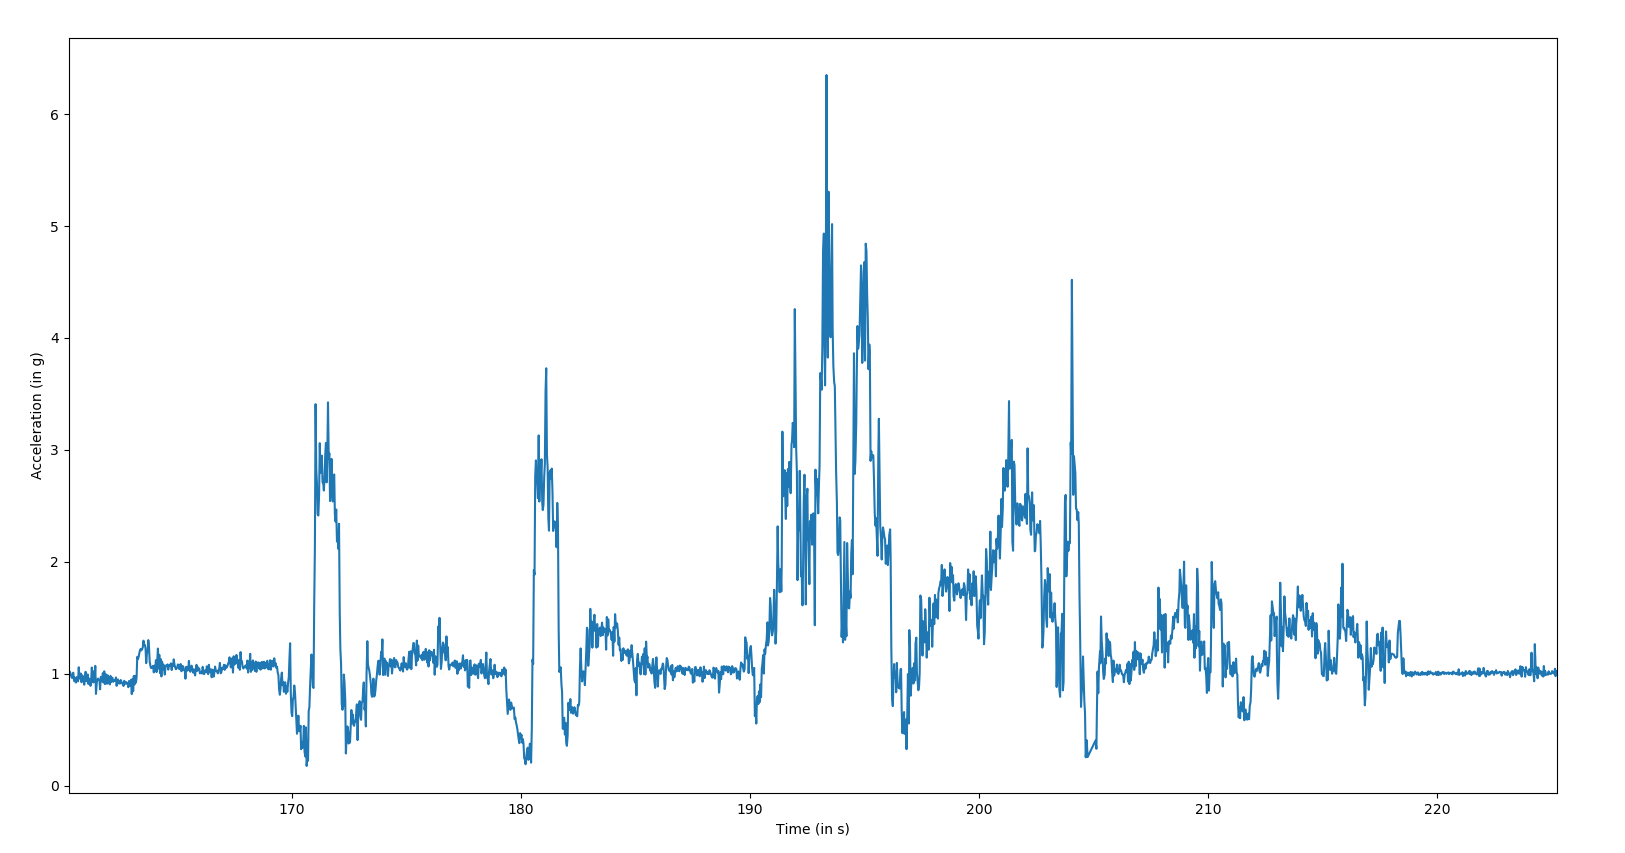
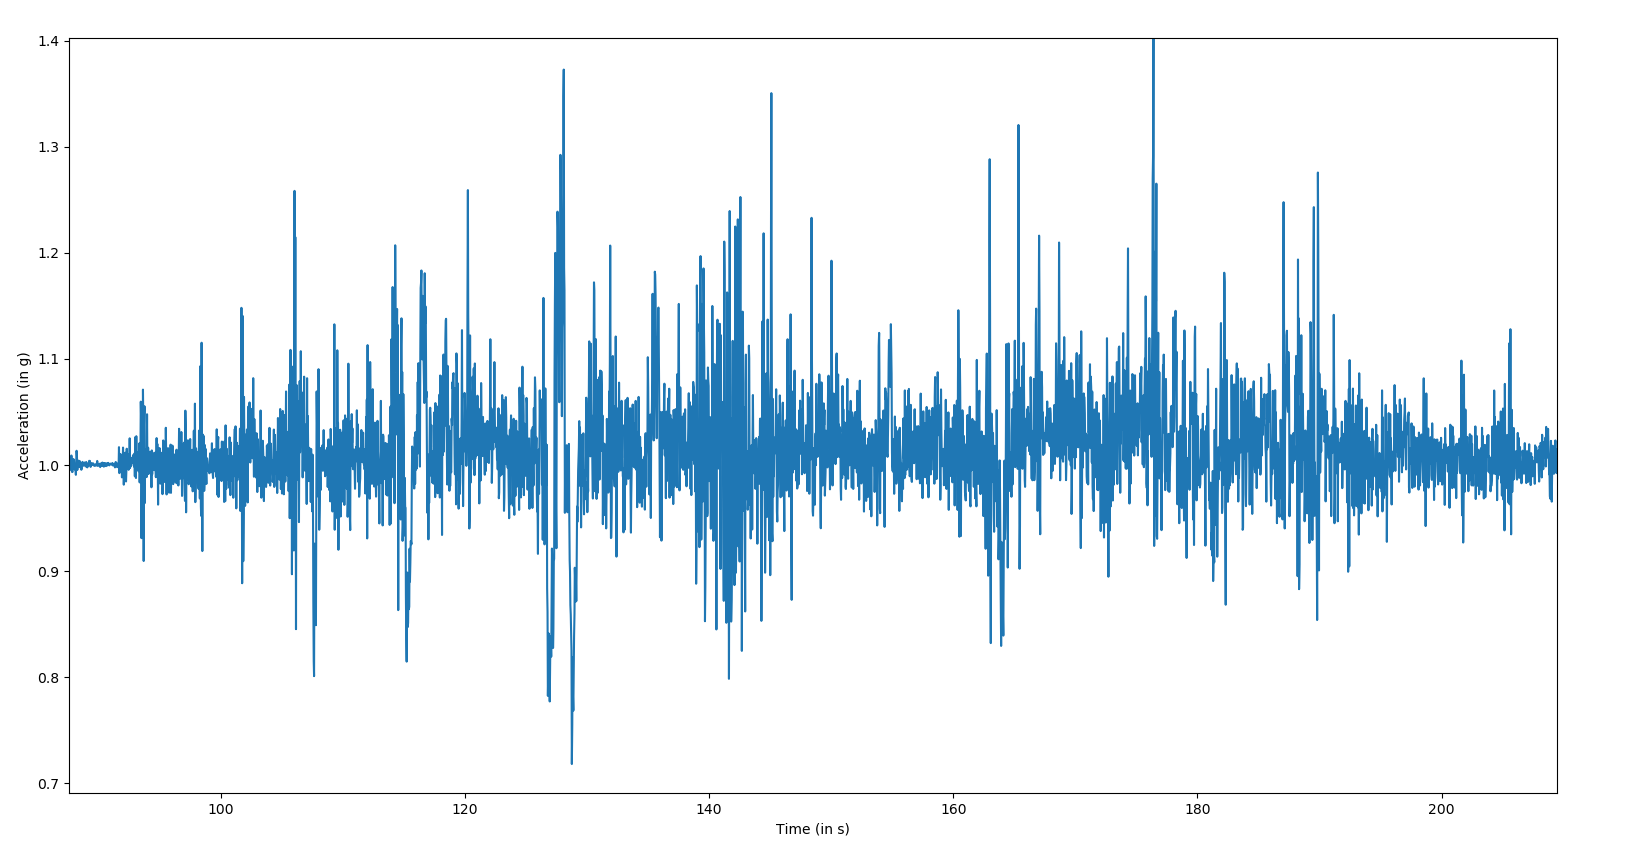
Hyperspace Mountain is a (loosely) Star-Wars themed roller coaster. As with Indiana Jones, there are a lot of sharp turns and loops. The acceleration measured is the following:
We can see a lot of very intense peaks of acceleration. There is also a long pause where a Star Wars-themed light show is presented.
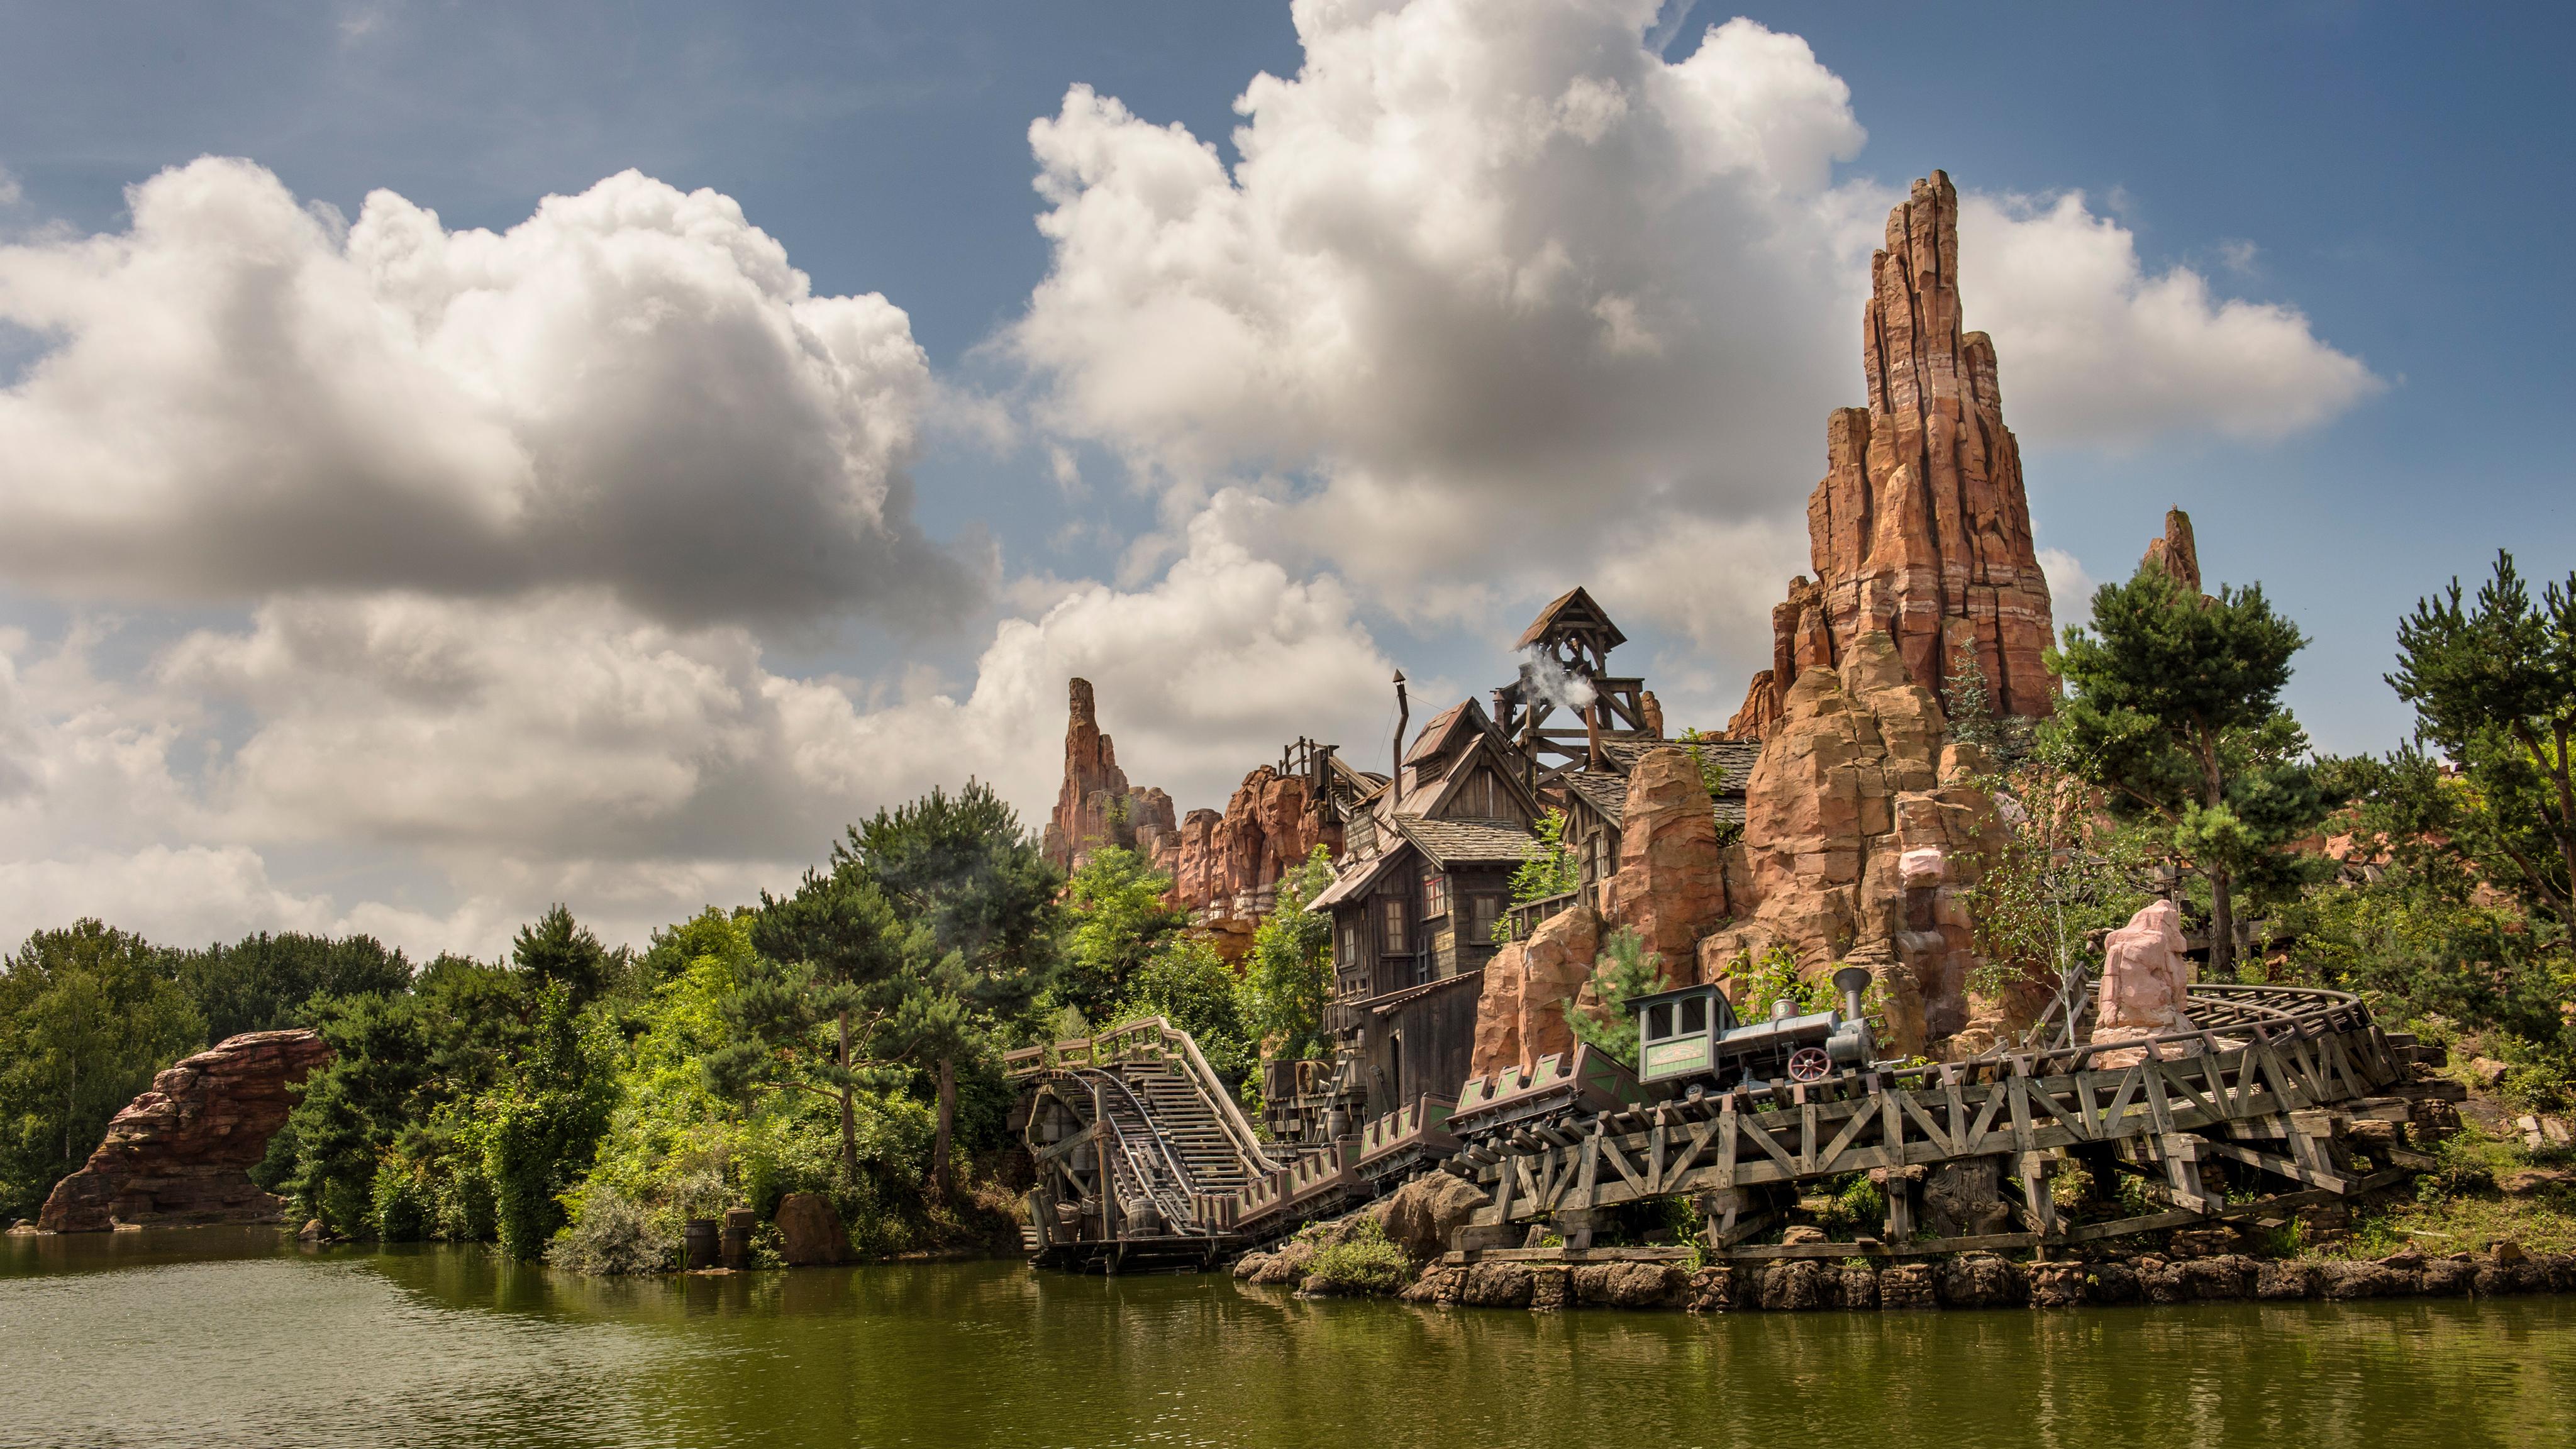
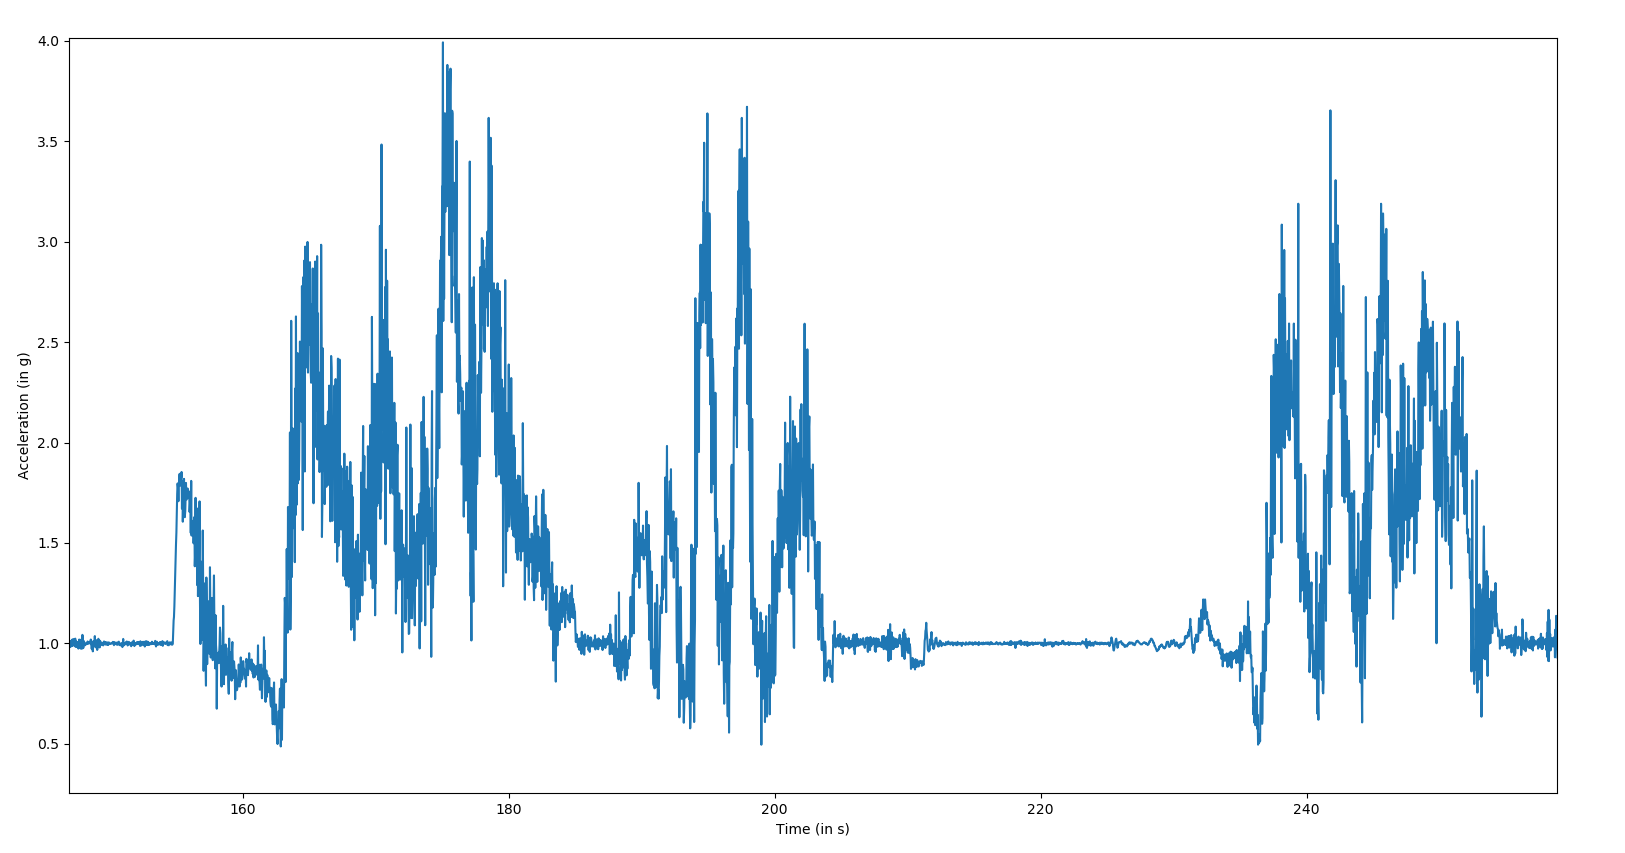
Big Thunder Mountain is a softer ride inspired by minecarts. The acceleration measured is the following:
As we can see, the acceleration is way lower than on the previous rides. Furthermore, we can see some long periods with no acceleration, this is where the minecart is being pulled up by chains to gain potential energy.

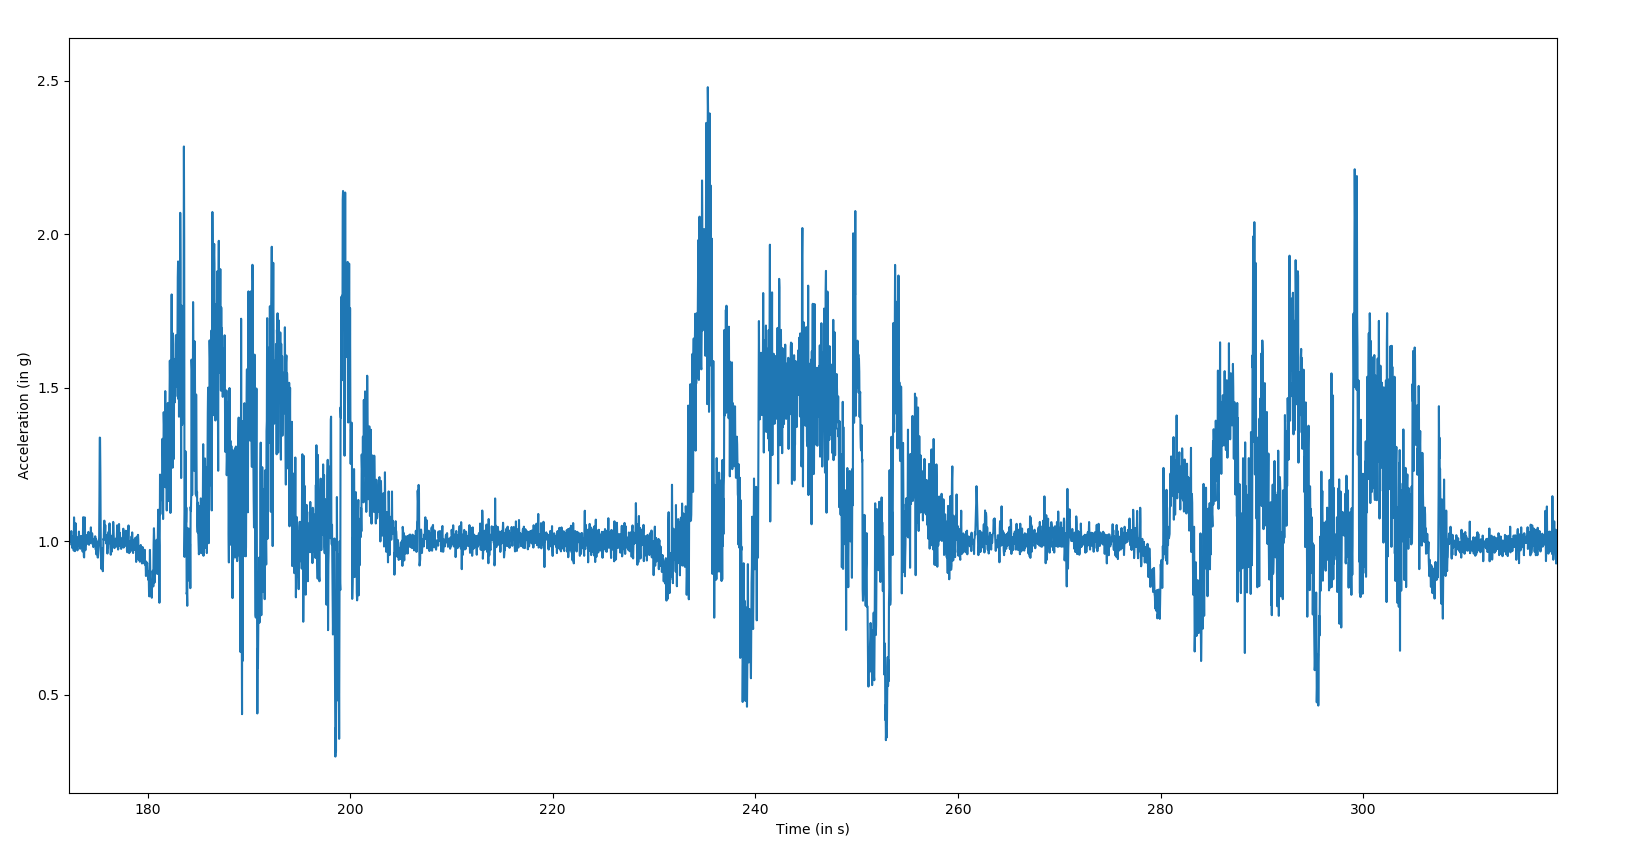
Casey Jr. Circus Train is a ride targeted at smaller children. A small train takes the voyagers through a well-landscaped part of the park. The acceleration measured is the following:
As we can see, the acceleration is very low, we can not observe any strong turn.
The measurements were made with a smartphone in my pocket. As the phone was not secured to the rides, my body and the freedom of movement of the phone might have acted as a mechanical filter which could have changed the graphs a bit. Furthermore, to make the graphs more readable, I used a decimation filter. This is not an issue as all the interesting patterns are at a way lower frequency than what the filters cut.
If you need the raw data for your personal use, send me an e-mail and I will give them to you.